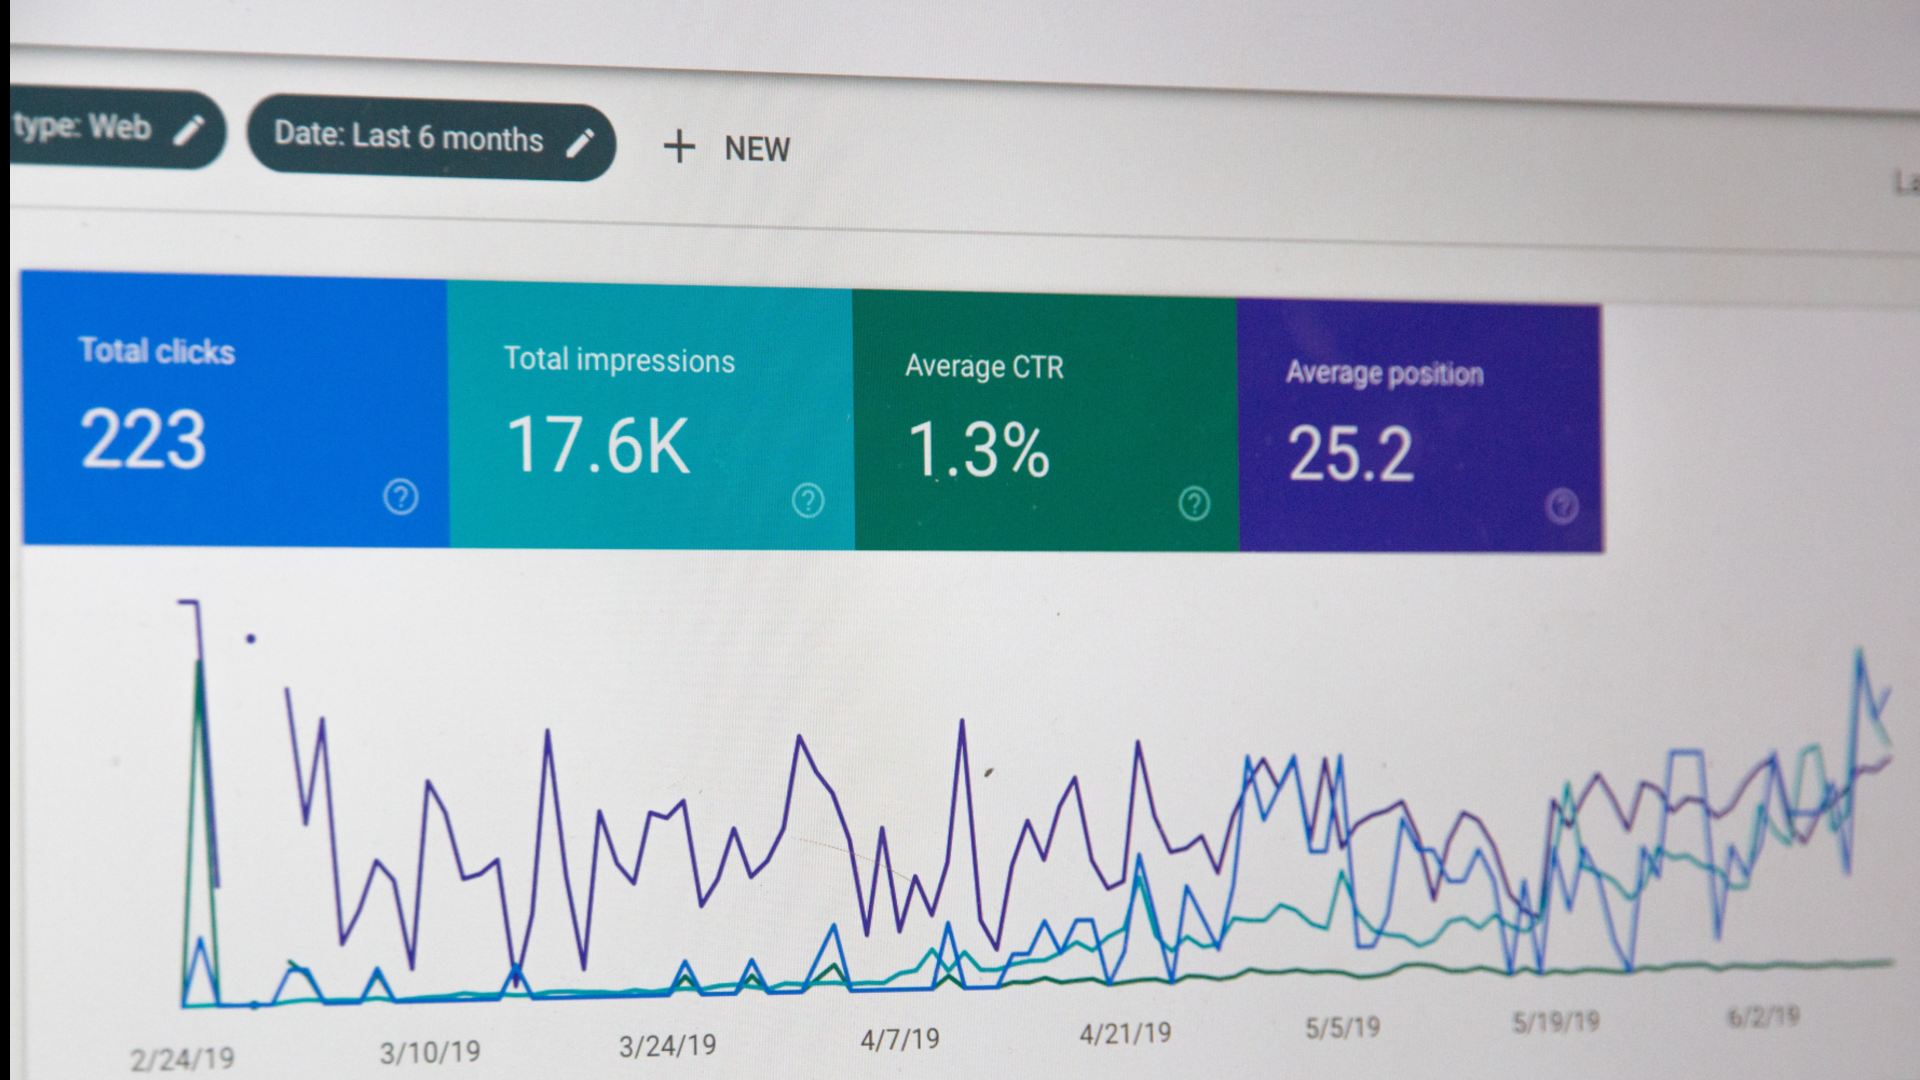
Website traffic analysis examines how visitors find and interact with your website. This process helps you make smarter decisions about content, marketing, and growth. In Google Analytics 4 (GA4), your traffic data lives across a handful of key reports. Knowing how to read them separates actionable insight from a wall of numbers.
This guide walks you through website traffic analysis in GA4 — step by step, report by report.
What Is Website Traffic Analysis and Why Does It Matter?
Website traffic analysis means understanding what your visitor data tells you. It reveals where people come from, what they do when they arrive, and whether those actions align with your goals.
Without analysis, traffic data is noise. With it, you can identify which channels are working and which pages are underperforming. You can also see where you’re losing visitors before they convert.
Traffic analysis isn’t a one-time task — it’s a habit. Even a 15-minute weekly check against the right reports gives you a significant edge over most site owners.
Where Do You Start in GA4?
The Home dashboard appears when you open GA4. It shows a quick summary, but real analysis happens elsewhere. For proper website traffic analysis, you’ll work across three main areas:
- Reports > Acquisition — where your traffic comes from
- Reports > Engagement — what visitors do when they arrive
- Explore — custom analysis and deeper segmentation
Start with Acquisition. Everything else builds on knowing your traffic sources.
How Do You Read the Traffic Acquisition Report?
Go to Reports > Acquisition > Traffic Acquisition. This is the most important report for website traffic analysis.
The table shows your traffic broken down by Session Default Channel Group. This is GA4’s way of categorising where sessions came from. You’ll typically see channels like Organic Search, Direct, Referral, Organic Social, Email, and Paid Search.
For each channel, GA4 shows:
- Sessions — how many visits came from this channel
- Engaged sessions — sessions lasting longer than 10 seconds, with a conversion, or with 2+ pageviews
- Engagement rate — the percentage of sessions that were engaged
- Conversions — goal completions attributed to the channel
A healthy site typically sees an engagement rate of 50–70%. If a channel shows under 30% engagement, that traffic is low quality. Visitors are arriving and leaving almost immediately.
What’s the Difference Between Sessions and Users in GA4?
GA4 replaced Universal Analytics metrics with new ones. This trips many people up during website traffic analysis.
Users are unique people, estimated based on device IDs and Google signals. Sessions are individual visits — one user can generate multiple sessions.
GA4 also includes a new metric: Active Users. This counts users who had at least one engaged session. It’s often the number displayed as “Users” in standard reports.
For traffic volume trends, track Sessions. For audience size, use Active Users. Don’t mix them up when comparing periods.
How Do You Identify Which Channels Are Actually Working?
Judging traffic quality is the core of website traffic analysis. It’s not enough to see where traffic comes from.
Sort your Traffic Acquisition report by Engaged Sessions instead of total sessions. This shows which channels send visitors who stick around.
Next, compare channels by Conversions (or key events, in GA4 language). A channel sending 5,000 sessions with 2 conversions is less valuable than one sending 500 sessions with 40 conversions. Volume without outcome is vanity.
Look for these patterns:
- High sessions + high engagement rate = strong channel, keep investing
- High sessions + low engagement rate = traffic quality problem, investigate the source
- Low sessions + high engagement rate = underinvested channel with real potential
- Low sessions + low engagement rate = deprioritise or fix
How Do You Drill Into a Specific Traffic Source?
Click on any channel in the Traffic Acquisition report to expand it. This breaks down the channel into individual Session Sources. For example, under Organic Search, you’d see google / organic, bing / organic, and so on.
You can also change the primary dimension from “Session Default Channel Group” to Session Source/Medium. This gives you a more granular view. It’s especially useful for referral and social traffic, where you want to see exactly which sites or platforms send visitors.
For deeper investigation, use the Explore section. Build a free-form exploration with Source/Medium and Landing Page as dimensions. This helps you understand which landing pages different sources reach.
What Does the User Acquisition Report Tell You?
GA4 has two acquisition reports: Traffic Acquisition (session-level) and User Acquisition (user-level). The User Acquisition report shows how users first discovered your site — their first touch channel.
This matters for understanding top-of-funnel performance. If most new users come from Organic Search but most engaged sessions come from Email, your email list is your most valuable asset. This is true even if it’s not your biggest traffic driver.
Use both reports together. User Acquisition tells you about discovery. Traffic Acquisition tells you about behaviour.
How Do You Spot Traffic Trends Over Time?
GA4’s default date range is the last 28 days. For meaningful website traffic analysis, compare it to the previous period using the comparison toggle in the date picker.
Look for:
- Channels with significant drops — could signal a Google algorithm update (Organic Search) or campaign pause (Paid Search)
- Channels with unexpected spikes — could be viral content, press coverage, or bot traffic
- Consistent week-over-week patterns — most B2B sites see lower weekend traffic, which is normal
Tip: Always check if a traffic spike has a matching rise in engaged sessions. A spike with flat or falling engagement usually means low-quality or automated traffic, not genuine growth.
What Are the Most Important Metrics for Website Traffic Analysis?
Focus on these in your regular GA4 review:
- Sessions — overall traffic volume
- Engaged Sessions — quality filter on your traffic
- Engagement Rate — percentage of meaningful visits (aim for 50%+)
- Average Engagement Time — how long people spend (GA4’s replacement for Bounce Rate)
- Conversions / Key Events — whether traffic is achieving your goals
- New vs. Returning Users — growth vs. retention balance
GA4 replaced Bounce Rate with Engagement Rate. A low engagement rate (say, 25%) equals a high bounce rate. It means visitors are leaving quickly without interacting.
How Do You Use GA4 Data to Make Decisions?
Data without action is reporting. Here’s how to turn website traffic analysis into decisions:
If Organic Search is your top engaged channel: Invest in more SEO content. Identify which pages rank and drive engaged sessions. Then build topically related content around them.
If Direct traffic is unusually high: Some of it may be mis-classified traffic. GA4 attributes sessions as Direct when it can’t identify the source. This often includes email clients, messaging apps, and some AI referrals. Check if your UTM tagging is consistent.
If you want faster results while your organic channels grow: Many site owners buy website traffic to supplement organic growth. This lets them test landing pages at volume before committing to long-term content strategies.
If one channel has high sessions but low conversions: The traffic-to-conversion funnel is broken somewhere. Check the landing pages that channel drives to. They may need stronger CTAs, faster load times, or better content alignment with visitor expectations.
How Does This Differ From Just Looking at Page Views?
Page views are the most basic traffic metric and the easiest to be misled by. A page with 10,000 views and 10% engagement rate has fewer real readers than a page with 1,000 views and 75% engagement rate.
Website traffic analysis goes beyond page views to understand quality. For a deeper look at setting up GA4 tracking correctly before you analyse, read our guide on how to track traffic in GA4.
How Often Should You Do Website Traffic Analysis?
A practical cadence for most site owners:
- Weekly: Quick check of total sessions, top channels, and any unusual spikes or drops
- Monthly: Channel-by-channel review — engagement rates, conversions, trends vs. prior month
- Quarterly: Deep-dive on what’s growing, what’s stagnating, and where to reallocate effort
The weekly check takes under 10 minutes once you know where to look. The monthly review is where you make strategy decisions. Don’t skip either.
Quick Summary: Website Traffic Analysis in GA4
Website traffic analysis in GA4 means moving beyond raw visitor counts. You need to understand your traffic at a channel and quality level. The Traffic Acquisition report is your starting point. Engaged Sessions and Engagement Rate are your quality filters. Conversions tell you whether any of it matters for your business.
Make it a habit, not a one-off. Regular, focused traffic analysis is one of the highest-leverage activities you can do. It tells you where to invest, where to fix, and where to stop wasting effort.